
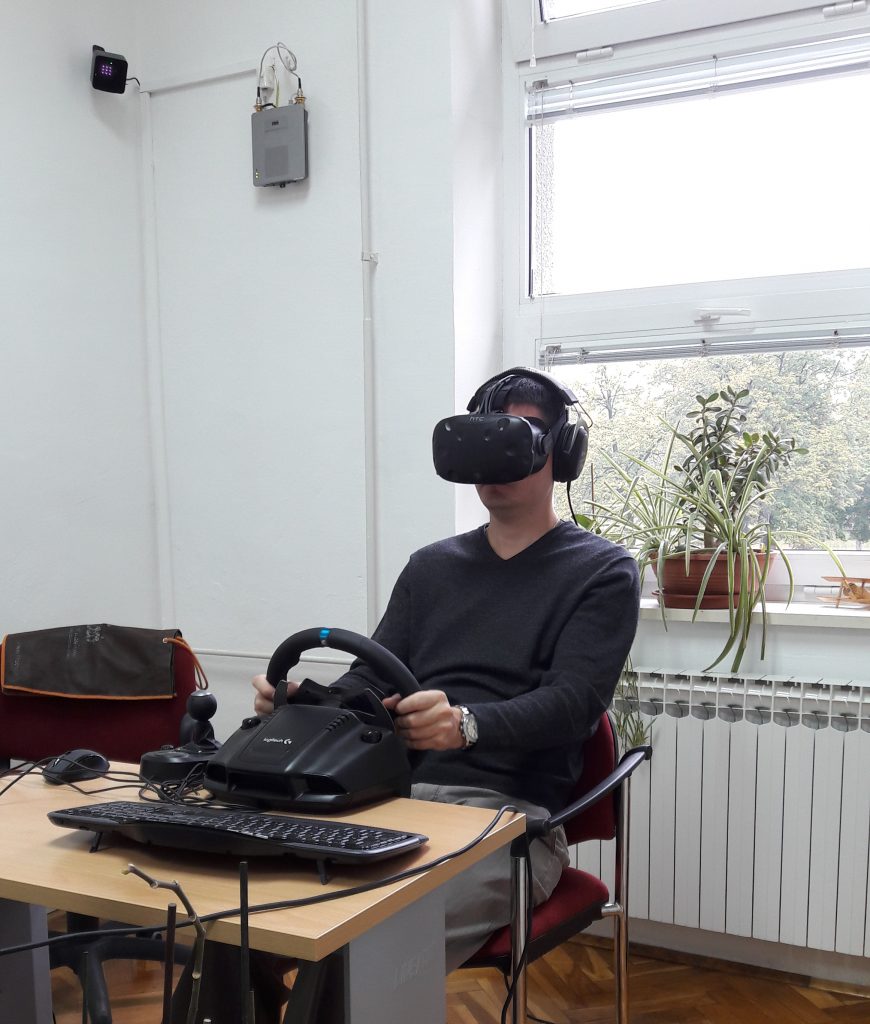
 In the last two weeks or so we were conducting a small-scale test of user QoE while playing the popular Project Cars racing game in VR. For now, we have downloaded free-to-play version of the game from Steam service, i.e. Project Cars – Pagani Edition, and conducted a test only with our colleagues. Since the Project Cars is the racing simulation we plugged into our test computer Logitech G29 racing wheel to ensure (almost) full racing experience. Ten of our colleagues participated in the research and here we bring you some results.
Remember that this was the initial test. The sole objective of the test was to see if our test environment is suitable for this kind of experiments. The game was played by our test subjects in Single Player mode, so there was no disruption of game presentation quality (in terms of, for instance, frame rate drops due to the increased packet loss during an Online Multiplayer gaming). That is something that we will test later in the project. Note that the computer used for testing managed to maintain stable 50 to 60 FPS in Ultra level of details and HD resolution.
Basic information about our test subjects
Here are some data describing basic characteristics of our sample in this test. Namely, we had 20% of female and 80% of male participants. On a scale from 1 to 5, where 1 meant No experience and 5 meant Extensive experience, five test subjects rated their previous racing experience in computer games with 1, two test subjects rated it with 3 and another two rated it with 4, while one test subject rated it with 5. On average, the previous racing experience (in or out of VR) of the test group equaled to 2.4, while the average racing experience in this particular game equaled to 1.4.
Test subjects’ performance
All test subjects drove the same car in a Single Player mode around Monza GP circuit, under the same game conditions (e.g. weather conditions and vehicle setup). Test subjects were allowed to play as much as they like since we did not want to force anyone to play if, for instance, they started to feel discomfort. Hence, here are some lap times of our racing drivers.
| Test subject | Number of driven laps | Best lap time |
|---|---|---|
| TS01 | 1 | No record |
| TS02 | 4 | 2 min 30.107 sec |
| TS03 | 1 | No record |
| TS04 | 15 | 1 min 50.933 sec |
| TS05 | 7 | 1 min 54.996 sec |
| TS06 | 5 | 2 min 37.500 sec |
| TS07 | 1 | No record |
| TS08 | 4 | 2 min 34.180 sec |
| TS09 | 1 | No record |
| TS10 | 5 | 2 min 32.458 sec |
We can see that the two test subjects with most racing experience in computer games (TS04 and 05) achieved the best lap times, while other subjects have still some practice to do. Note that the game did not record a lap time if a test subjects cut the track or if he or she went off the track. This happened for test subject number 1, 3, 7 and 9. Interestingly, these test subjects drove only one lap around the track and then ended the session due to feeling discomfort. Continue reading this post to see why they felt discomfort.
User Quality of Experience
Average user Quality of Experience equaled to 4.15 (on a scale from 1 to 5, where 1 means Worst experience and 5 means Excellent experience). Apart from the QoE, here we wanted to cross compare the level of discomfort of the test subjects. This was also done on the 5 point scale where 1 means No discomfort at all and 5 means Extremely discomfort experience.
As we noted earlier, test subjects 1, 3, 7 and 9 drove only one lap around the track. With the exception of TS01, other test subjects from this group reported higher discomfort level. We believe that this is because test subjects 3, 7 and 9 wear glasses in order to see correctly and they had to take them off in order to put VR headset on, so this probably impacted their discomfort level. Note also that TS01 did not felt discomfort in terms of nausea, disorientation etc. like other three test subjects from this group. TS01 felt fear after losing the control over the car and discontinued the session because of that.
Perception of time
Lastly, we want to share with you another interesting finding. Half or our test subjects felt that their session lasted shorter compared to the actual passage of time. The most distinctive difference is recorded for test subject number 4 who thought that the session lasted 10 minutes shorter than it actually was. Note that this test subject had probably the most fun: he set the best lap time and achieved a high level of QoE with no discomfort (yet this test subject was the most experienced one, in terms of playing racing games).
| Test subject | Session duration [min] | Subjective feeling about the session duration [min] | Difference |
|---|---|---|---|
| TS01 | 2 | 4,5 | -2.5 |
| TS02 | 15 | 10 | 5 |
| TS03 | 4 | 6.5 | -2.5 |
| TS04 | 30 | 20 | 10 |
| TS05 | 20 | 15 | 5 |
| TS06 | 20 | 20 | 0 |
| TS07 | 2 | 2 | 0 |
| TS08 | 15 | 15 | 0 |
| TS09 | 3 | 1.5 | 2.5 |
| TS10 | 10 | 6 | 4 |
If you want to see more results come back here from time to time. We will be happy to share it with you. If you want to comment on anything, please write to us in the comments section.